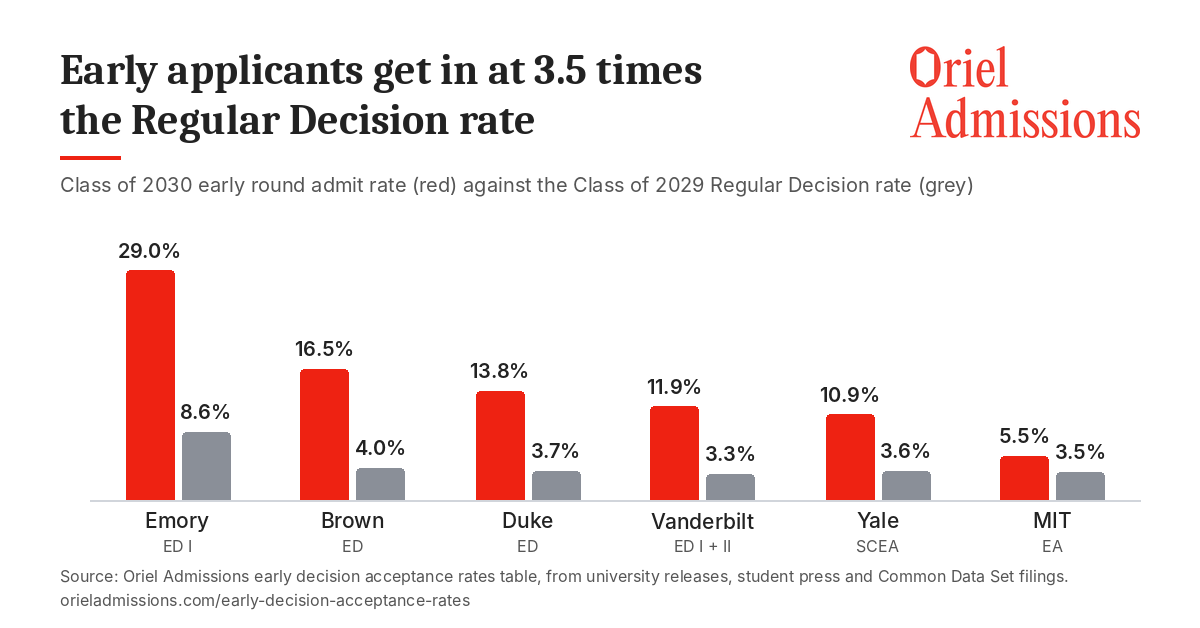
Duke admitted 13.8% of Early Decision applicants against a Regular Decision rate near 3.7%; across 21 selective colleges the median early multiplier is 3.5x
PRINCETON, NJ, UNITED STATES, October 12, 2026 /EINPresswire.com/ — Early applicants to selective colleges are admitted at a median of 3.5 times the Regular Decision rate, according to the early decision acceptance rates table published by Oriel Admissions, a college admissions consulting firm serving families nationwide. The table, updated ahead of the November 1 early application deadlines, covers 24 selective colleges and pairs each school’s most recent early round admit rate with its Regular Decision rate to produce an early multiplier. Across the 21 colleges where the two rates can be paired, the median early multiplier is 3.5x. Among the 16 of those colleges with binding Early Decision, the median is about 3.7x.
Class of 2030 early round results, as reported by the universities and their student newspapers between December 2025 and February 2026:
• Duke admitted 847 of 6,159 Early Decision applicants, 13.8% as Duke reports it, with 116 of the admits arriving through the QuestBridge match. The Regular Decision rate has run near 3.7%, and the early admits make up roughly half of the incoming class.
• Brown admitted 890 of 5,406 Early Decision applicants, 16.5%, against a Regular Decision rate near 4.0%.
• Yale admitted 779 of 7,140 Single Choice Early Action applicants, 10.9%, against a Regular Decision rate near 3.6%.
• Vanderbilt admitted 11.9% of applicants across Early Decision I and II, against a Regular Decision rate of 3.3%. About half of the class enters through the early rounds.
• Emory, which also runs an Early Decision II round, admitted 1,041 of a record 3,593 Early Decision I applicants, 29.0%. Its Regular Decision rate for the prior cycle, derived from its Common Data Set, was 8.6%. The figure covers the first binding round only.
• MIT, whose Early Action is non-binding, admitted 655 of 11,883 early applicants, 5.5%, against a Regular Decision rate near 3.5%.
Among the eight Ivy League colleges the multiplier runs from 2.8x at Cornell to 5.7x at Dartmouth, which reported 768 admits from 3,552 Early Decision applications for the Class of 2029 in its Common Data Set, a 21.6% rate against a Regular Decision rate near 3.8%. At the other end of the table, non-binding Early Action carries far less edge: the multiplier at MIT is below 2x.
The table also records what each college declines to say. Harvard withheld its Class of 2030 early data, Princeton does not publish round level figures, Stanford stopped publishing round level admit data years ago, and NYU and the University of Chicago publish no early round rates. Duke’s own December announcement omitted the application count and the rate; the university supplied both after The Duke Chronicle reported the omission. Oriel Admissions tracks disclosure across 50 universities in its College Admissions Transparency Index.
The table notes that the raw multiplier overstates the causal edge. Early pools concentrate recruited athletes, legacy applicants and students ready to commit in November, so part of every gap is self-selection. Vanderbilt admissions leadership has said that admitted early and regular students look identical on test scores, class rank and the number of advanced courses, and that what differs is the size of the pool: about 7,000 early applicants against roughly 48,000 in Regular Decision.
“About half of the class at Duke and Vanderbilt is filled before Regular Decision opens, so the binding round is where the real competition for a seat happens,” said Rona Aydin, founder of Oriel Admissions. “The multiplier is real, but it belongs to students whose application is ready in November. A rushed essay or a junior year transcript dip converts none of it.”
Figures come from university releases, Common Data Set filings and student press reporting for the Classes of 2028 through 2030. Early and Regular Decision rates are as each college reports them. Multipliers use same cycle pairs where both numbers exist and adjacent cycles where they do not, and the table marks those with a tilde. Where a college has withheld recent counts, the table says so and uses the last published figure. The full table, with a note on each school’s disclosure, is at https://orieladmissions.com/early-decision-acceptance-rates/.
Oriel Admissions also publishes a list of Early Decision II schools, an Early Decision versus Regular Decision advantage calculator, and a guide to what happens when a student breaks an Early Decision agreement.
About Oriel Admissions
Oriel Admissions is a college admissions consulting firm serving families nationwide on elite university admissions strategy, with offices in Princeton, New Jersey and New York. Its founder, Rona Aydin, has discussed admissions on the NPR program 1A and in The Hechinger Report. Oriel Admissions also publishes the College Admissions Transparency Index.
Rona Aydin
Oriel Admissions
hello@orieladmissions.com
Visit us on social media:
LinkedIn
Legal Disclaimer:
EIN Presswire provides this news content “as is” without warranty of any kind. We do not accept any responsibility or liability
for the accuracy, content, images, videos, licenses, completeness, legality, or reliability of the information contained in this
article. If you have any complaints or copyright issues related to this article, kindly contact the author above.

Media gallery